Links to Independent sources for energy information.
-

Electricity Costs Forecast to start rising again - will be above 2022's peak in 2025!
The US Government’s department of US Energy Information is forecasting that the average US energy cost will start to rise again after a slight dip in 2024. The peaks we experienced in 2022- 2023 will be exceeded by 2025. Think about your highest electric bills last year and those will be “normal” in 2025.
-
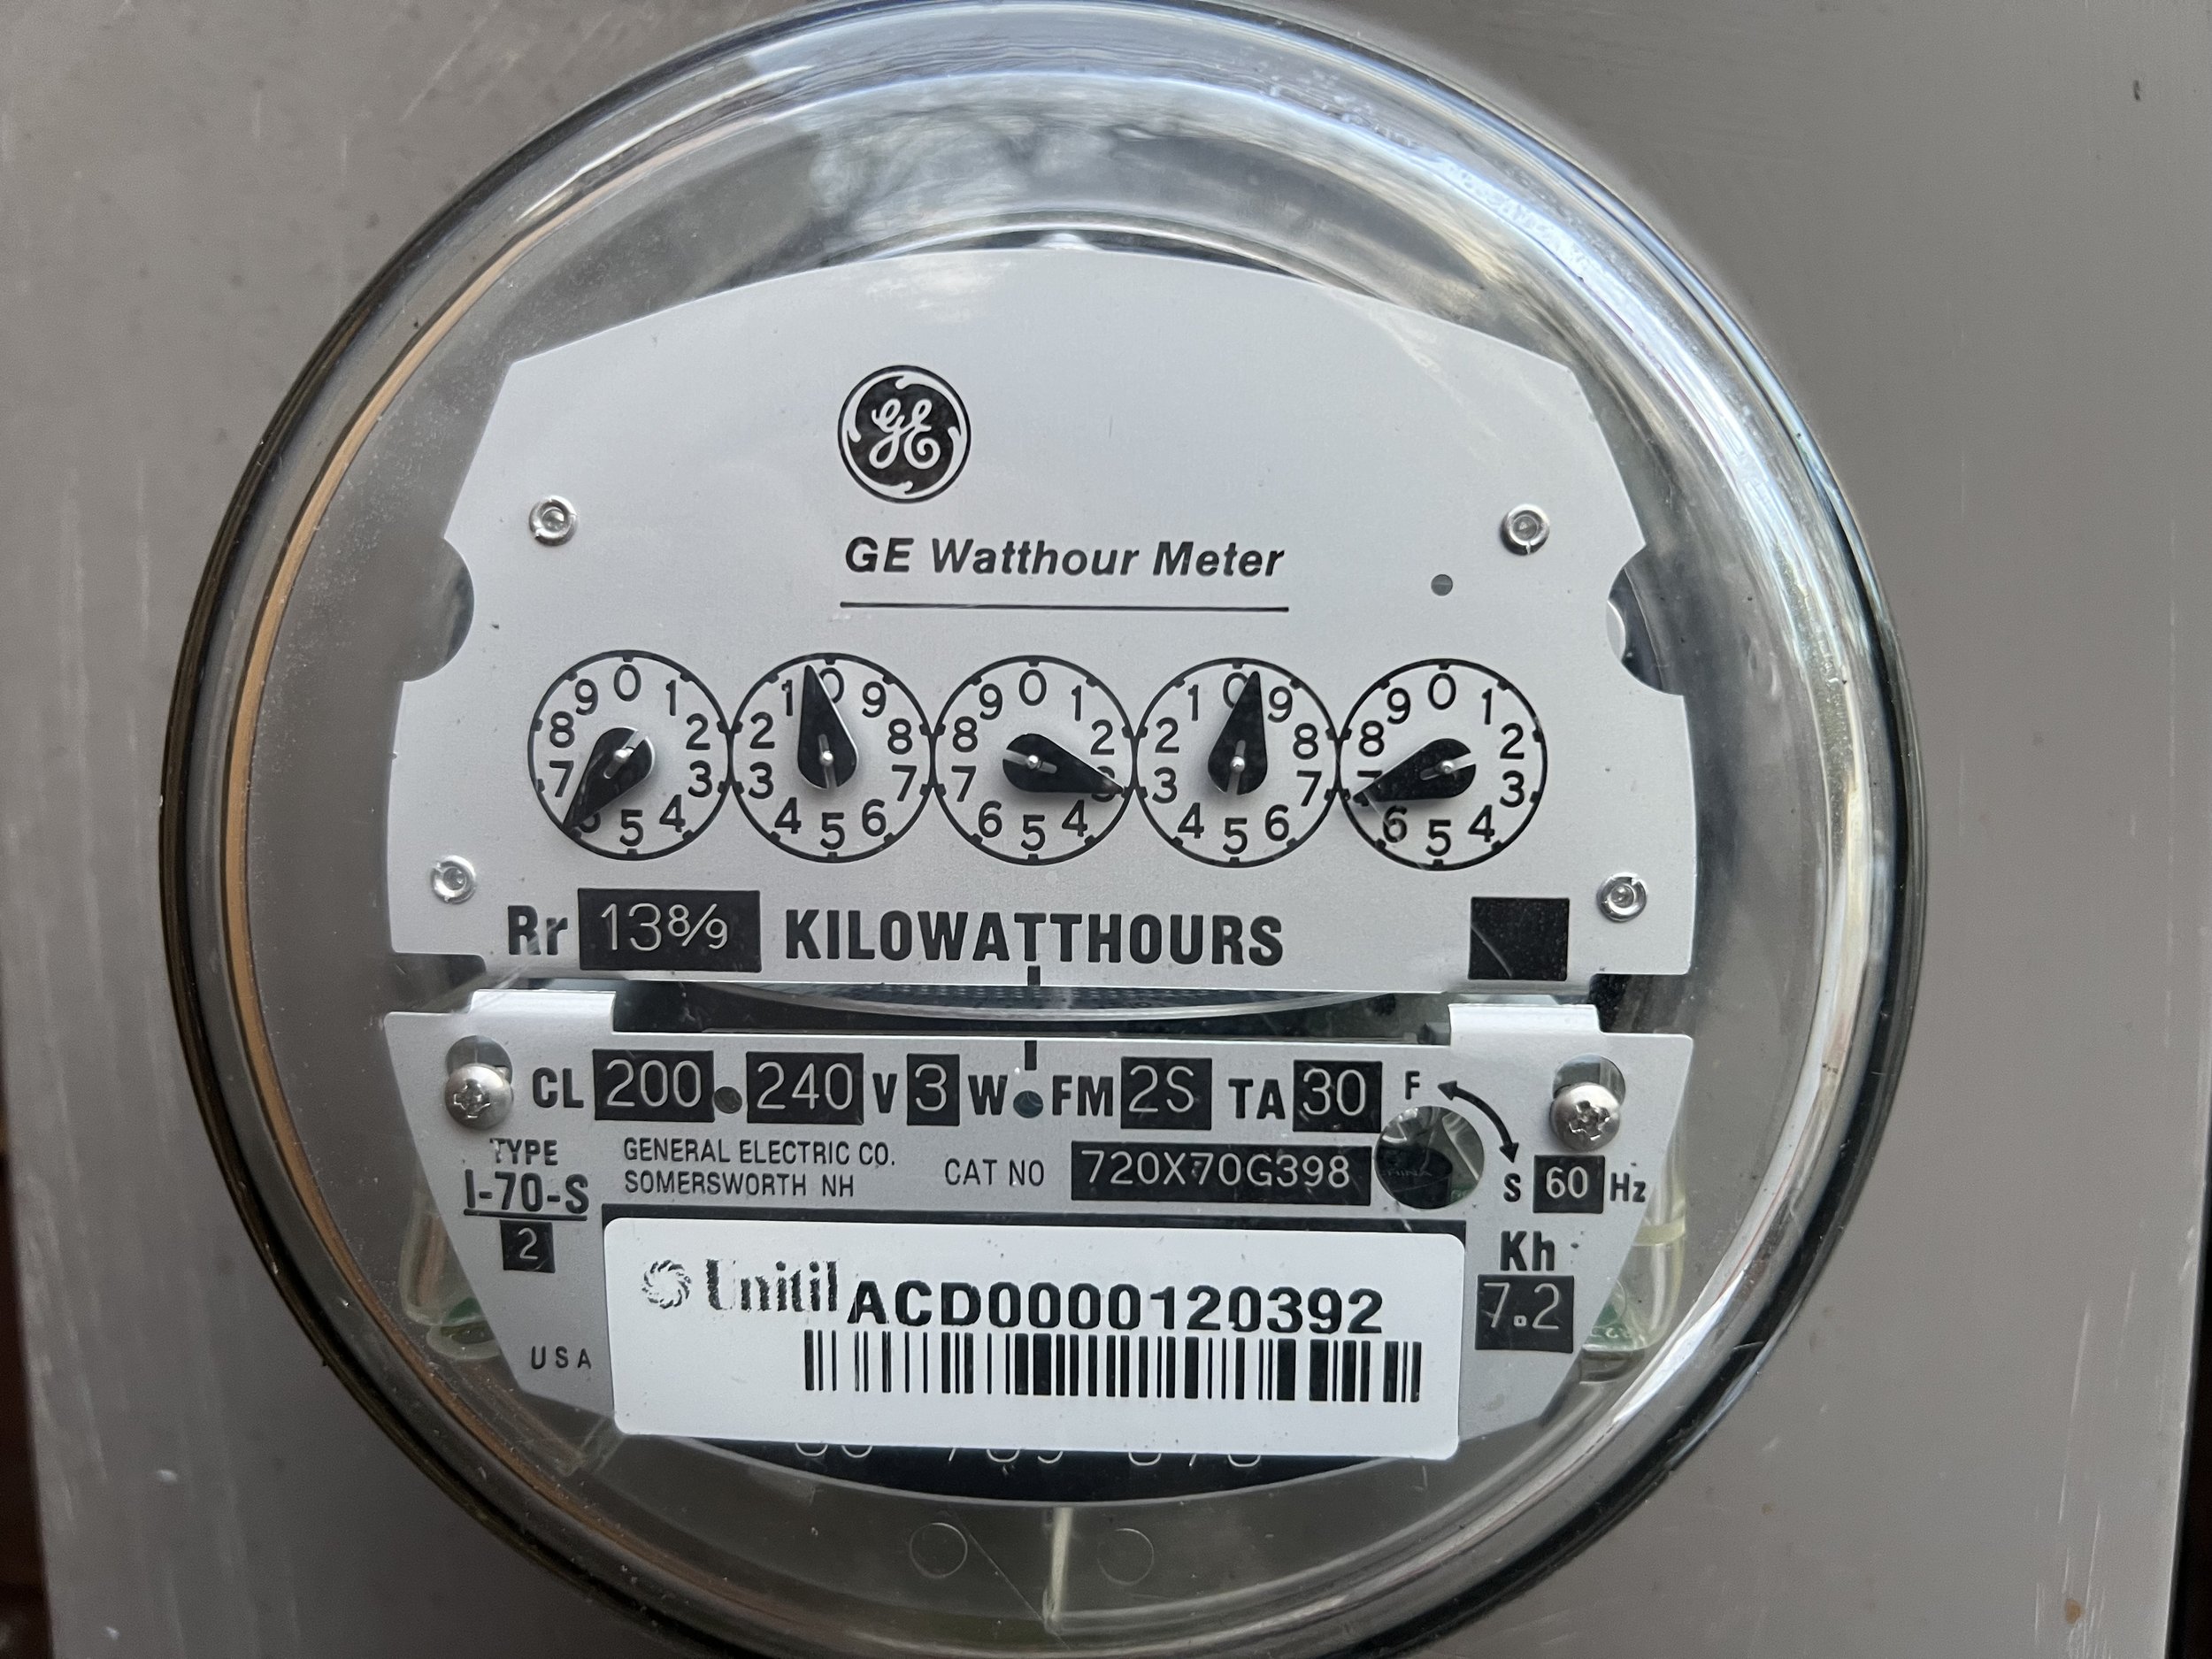
What is Net Metering
Perhaps the most important incentive provided to those going solar. Unfortunately, it is gradually being reduced for new solar customers. Old customers are “grandfathered”. Customers who net meter have a special meter which measures the difference between the electricity provided by the local utility and the electricity produced by an on-site renewable energy source.
-

Homeowner’s Guide to the Federal Tax Credit for Solar Photovoltaics
Government website explains the 30% Solar Tax Credit. An important note is that you need have federal tax liability (taxes) to get the tax credit. If you do not have enough tax liability in a single year, there are ways to spread the tax credit over more than one year. In some cases it is best to lease so the third party (ie,Sunrun) can make use of the tax credit and pass the savings to you.
-

NH Department of Energy - Homeowners guide to going solar in New Hampshire
Th State has assembled some excellent independent short videos to educate about the process of going soar. One video on tax incentives is out of date (the federal tax incentive is 30% for many more years) but the rest of the videos are still relevant.
-

Cost of Heat in New Hampshire
New Hampshire Department of Energy provides an excellent resource in this web page that is updated monthly with the current cost of various heating methods. Heating costs are normalized to MBTU so you can easily compare. Note how much lower electric heat, by heat pump, is compared to many other common methods.
-

California Duck Curve
US Energy Administration explains California’s “Duck curve” relating to the reduction on the grid demand during peak Solar Production and why California needs to build more energy storage before it can absorb more solar capacity. This is why they made such dramatic changes to their Net Metering agreement going forward.
-

New England Duck Curve
ISO New England explains the “Duck curve” relating to the reduction on the grid demand during peak Solar Production. This becomes an issue as more people use solar - (as happened in California) the Utilities and their oversite commission had to reduce the benefit of Net Metering for new solar customers. Soon, this will effect the viability for new solar customers in New England - explaining why it is important to go solar as soon as possible.